


 Guide
 February 26, 2026
Managing TikTok campaigns can feel like a puzzle where every piece matters, and missing the right data leads to wasted time. For social media marketers juggling audience growth and campaign effectiveness, understanding what drives engagement on TikTok is crucial. By demystifying key analytics concepts like algorithmic content recommendation and focusing on actionable metrics, you can decode what truly impacts reach and resonance in every country your brand targets.
Table of Contents
- Defining TikTok Analytics And Key Concepts
- Types Of TikTok Analytics Metrics Explained
- How TikTok Analytics Tools Function
- Practical Uses Of Analytics For Content Growth
- Common Pitfalls In Analyzing TikTok Data
Key Takeaways
| Point | Details |
|---|---|
| Understanding TikTok Analytics is Essential | Analytics help marketers grasp audience behavior and enhance content strategies, focusing on engagement rather than follower count. |
| Completion Rate is the Key Metric | Prioritize tracking completion rates over vanity metrics, as they indicate viewer interest and content effectiveness. |
| Actionable Insights Drive Growth | Use analytics to identify top-performing content patterns and make data-informed decisions for future videos. |
| Beware of Misleading Data | Avoid confusing correlation with causation and consider testing multiple variables before making strategic changes. |
Defining TikTok Analytics and Key Concepts
TikTok analytics is the systematic measurement and analysis of how your content performs on the platform. It goes beyond simple view counts to reveal who engages with your videos, when they watch, and what keeps them scrolling.

For marketers, understanding analytics means understanding your audience’s behavior. You’ll see which videos drive meaningful engagement, which sounds resonate most, and when your followers are most active. This data directly shapes your content strategy.
What TikTok Analytics Actually Measures
TikTok’s analytics dashboard tracks multiple performance dimensions:
- Video metrics: Views, likes, comments, shares, and completion rate
- Audience insights: Follower growth, peak activity times, geographic location, and age ranges
- Content performance: Which hashtags drive traffic, which sounds perform best, and trending topics in your niche
- Engagement depth: How long viewers watch, whether they replay, and if they follow after watching
The TikTok algorithm’s role in content recommendation fundamentally shapes what metrics matter most. Videos that keep viewers watching longer get pushed to more feeds, making watch time your most critical success indicator.
Core Analytics Concepts for Marketers
The “For You Page” (FYP) is where the algorithm decides if your content deserves visibility. Videos that perform well there generate exponential reach.
Engagement rate measures how many viewers interact with your content through likes, comments, or shares. A 5% engagement rate on a 10,000-view video means 500 interactions. That’s actionable data showing your content resonates.
Traffic sources reveal where your views originate. Some come from the FYP, others from followers, some from hashtags. Understanding this distribution helps you optimize for each source separately.
Completion rate indicates what percentage of viewers watch your entire video. A 60% completion rate on a 30-second video means most people stay engaged through the end. Low completion rates signal pacing or hook issues.
Track completion rate above all other metrics—it’s the strongest signal of whether your content actually resonates with viewers.
Audience demographics show you who’s actually watching. If your target market is women ages 18-24 but your audience skews 35+, your content strategy needs adjustment. Geographic data helps you identify where your strongest markets exist.
Why These Concepts Matter Right Now
TikTok’s algorithm prioritizes watch time and engagement above follower count. A creator with 10,000 followers but low engagement will get less reach than a creator with 1,000 followers whose content gets watched completely and shared frequently.
Understanding how data drives TikTok growth means you stop guessing and start testing. Each video becomes an experiment with measurable results.
Pro tip: Start by tracking one metric per week—pick the metric most relevant to your goal, understand its baseline, then work to improve it systematically rather than chasing every number simultaneously.
Types of TikTok Analytics Metrics Explained
Not all metrics deserve equal attention. TikTok’s analytics dashboard displays dozens of numbers, but only a handful directly impact your growth strategy. Understanding which metrics matter separates successful campaigns from vanity metrics that look good but drive no real results.
TikTok metrics fall into distinct categories, each revealing different insights about your content performance and audience behavior.
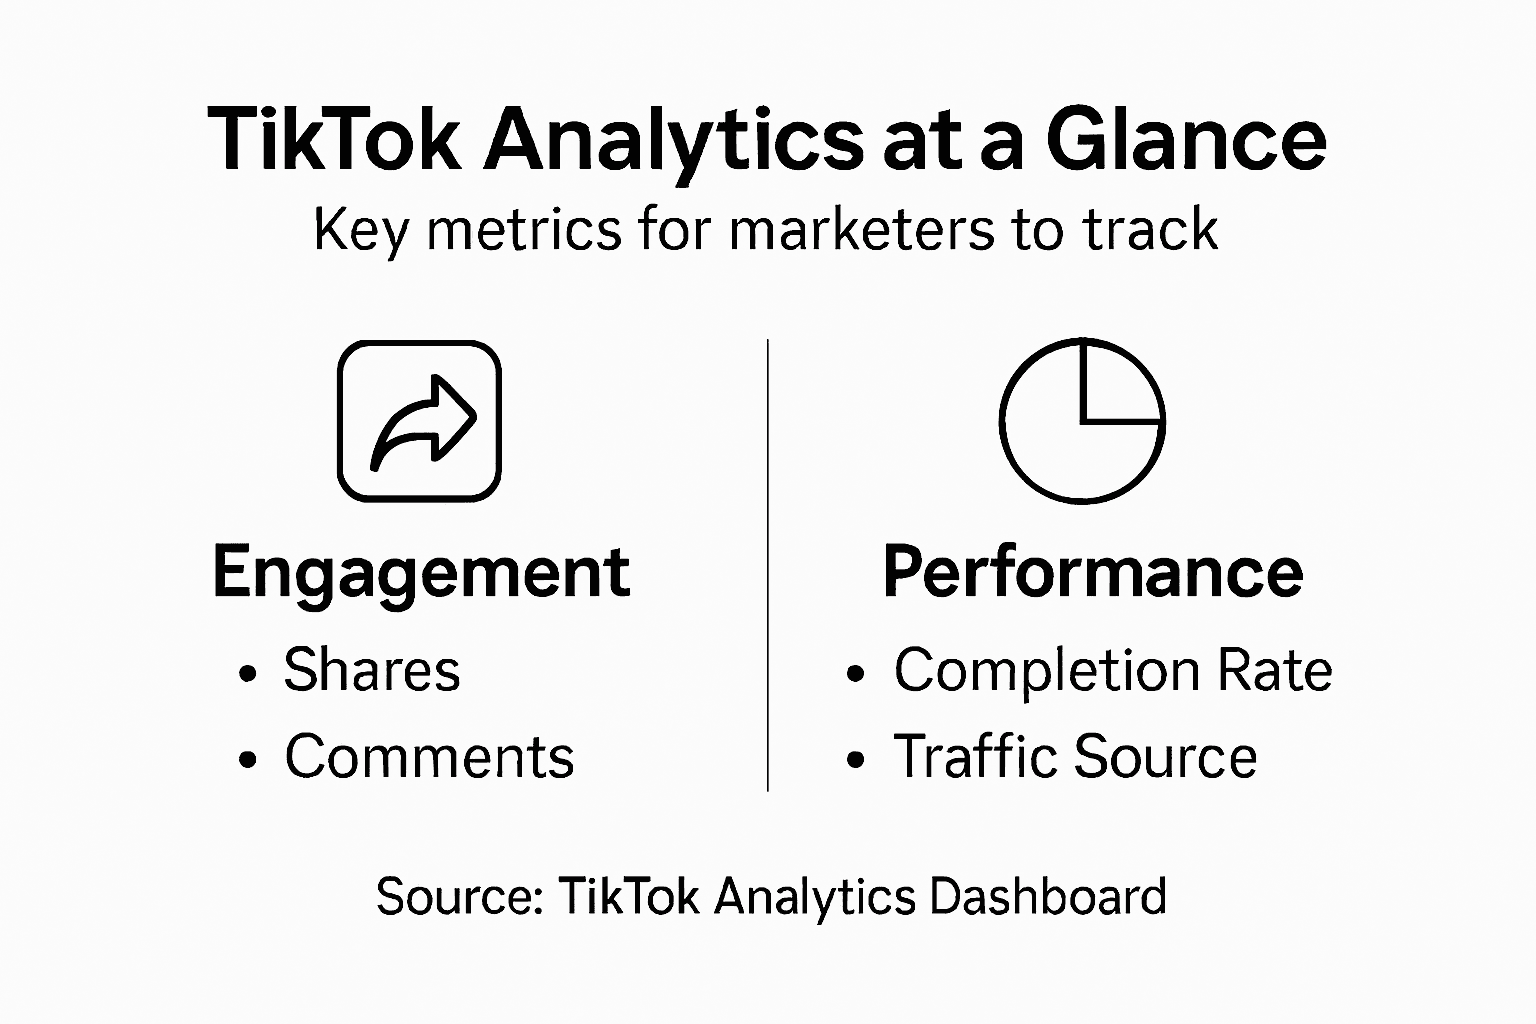
Vanity Metrics vs. Performance Metrics
Vanity metrics look impressive but don’t predict success. Views alone tell you how many people saw your video, not whether they actually cared. A video with 100,000 views but 50 likes suggests the algorithm showed it broadly to disinterested viewers.
Performance metrics measure actual engagement and intent:
- Likes: Direct approval signals from viewers
- Comments: Indicators of deeper engagement and conversation
- Shares: The strongest signal of content value
- Saves: Viewers bookmarking content to watch again
- Video completion rate: Percentage of viewers watching to the end
Focus on shares and completion rate above all else. When someone shares your video, they’re endorsing it to their network. That’s exponential reach.
This table outlines key differences between vanity metrics and performance metrics for TikTok marketers:
| Type of Metric | Primary Focus | Typical Misuse | Strategic Value |
|---|---|---|---|
| Vanity | Surface numbers | Chasing views for optics | None—low impact on true growth |
| Performance | Genuine engagement | Ignoring depth of action | Drives content and business strategy |
Here’s a quick reference showing how various TikTok performance metrics influence business outcomes:
| Metric | What It Reveals | Business Impact |
|---|---|---|
| Completion Rate | Viewer interest and retention | Higher reach, better targeting |
| Shares | Content’s viral potential | Exponential audience growth |
| Comments | Depth of audience engagement | Brand loyalty, market insight |
| Saves | Long-term content value | Repeat audience, future traffic |
| Traffic Source | Where audiences discover content | Smarter campaign targeting |
Engagement Metrics
Engagement rate is your conversion metric. It answers: of everyone who saw this video, how many actually interacted with it? Calculate it by dividing total engagements by total views and multiplying by 100.
High engagement rates (above 8-10%) signal content that resonates. Low rates indicate hooks that aren’t working or content misaligned with your audience expectations.
Understanding product engagement in TikTok videos reveals how viewers respond to branded content specifically. When you’re promoting products, track not just engagement but purchase intent signals within comments.
Comments matter more than you think. They indicate active interest. A video with 1,000 comments generates conversation algorithms favor heavily. Respond to comments quickly to boost your video’s performance window.
Audience Analytics
Your audience demographics reveal whether you’re reaching the right people. If your target market is Gen Z but your audience skews millennial, content adjustments are needed.
Key audience metrics include:
- Follower growth rate: How quickly your audience expands
- Peak activity times: When your audience is most active
- Geographic location: Where your viewers live
- Age and gender distribution: Demographic breakdown
- Returning viewers: Percentage of repeat watchers
Returning viewers matter more than total followers. An audience of 5,000 engaged repeat viewers drives more predictable growth than 50,000 one-time viewers.
Measuring user engagement patterns across platforms helps you understand what works beyond TikTok. If your TikTok audience overlaps with Instagram followers, content strategies can align.
Traffic Source Metrics
Where your views originate shapes your content strategy. The “For You Page” (FYP) drives discovery. Follower feeds drive loyalty. Hashtag clicks reveal trend awareness.
Breakdown your traffic sources to understand which content types reach which audiences. Videos that go viral typically start on the FYP. Consistent engagement builds from your follower feed.
Pro tip: Track completion rate weekly and identify patterns—if videos drop off at the 10-second mark, your hook needs work; if they drop at 25 seconds, your middle section isn’t holding attention.
How TikTok Analytics Tools Function
TikTok’s analytics tools aren’t simple dashboards—they’re powered by sophisticated machine learning systems that track thousands of data points in real time. Understanding how these tools work helps you interpret the numbers accurately and make smarter decisions.
At their core, TikTok analytics tools collect data from every user interaction and feed that information into recommendation algorithms that personalize content delivery.
The Data Collection Process
Every time someone watches your video, TikTok records multiple signals. Watch time. Pause points. Replays. Whether they watched with sound on. If they scrolled past or stopped to comment. Each interaction becomes a data point.
The platform also tracks viewer context:
- Device type: Mobile phone, tablet, or desktop
- Time of day: When the viewer accessed TikTok
- Location data: Geographic region and city
- Viewer history: What content this person typically watches
- Connection speed: WiFi versus cellular network quality
This granular data collection allows TikTok to understand not just what content performs, but why it performs and for whom.
How the Algorithm Processes Your Data
TikTok’s recommendation algorithm personalizes content based on viewer behavior patterns. The system doesn’t just count likes—it analyzes how long each viewer watches, whether they restart videos, and what they watch next.
This is why completion rate matters so much. A video watched completely signals strong interest to the algorithm. That signal gets amplified, pushing your content to more feeds.
Real-Time Analytics Processing
TikTok updates your analytics dashboard in near real time. You’ll see view counts, engagement metrics, and audience breakdowns updating throughout the day. This happens because TikTok’s infrastructure processes enormous volumes of data simultaneously.
ByteDance’s AI-based system architecture enables machine learning models to identify patterns humans couldn’t find manually. The system automatically detects trending sounds, emerging topics, and audience preferences.
Analytics tools show you what happened; your job is interpreting why and testing hypotheses to improve next time.
What You’re Actually Seeing
Your TikTok analytics dashboard displays processed and aggregated data. When you see “10,000 views,” that represents thousands of individual interactions compiled into that single number. Completion rate percentages reflect algorithmic calculations across all viewers.
Understanding this distinction matters. Raw data becomes analytics only after processing through algorithms. Those algorithms determine which metrics surface first and which remain buried in your dashboard.
When analyzing TikTok analytics workflows, remember that tools show correlations, not always causation. Your 30-second hook might correlate with high completion rates, but only testing different hooks confirms causation.
Pro tip: Export your analytics weekly and track trends across 4-week periods rather than obsessing over daily fluctuations—this reveals true patterns from algorithm noise.
Practical Uses of Analytics for Content Growth
Analytics without action is just noise. The real power emerges when you use data to make deliberate content decisions. Successful marketers treat analytics as a feedback loop—each video teaches you something about your audience.
There’s a direct path from understanding your analytics to scaling your growth. You just need to know where to look.
Identify Your Top-Performing Content Patterns
Start by analyzing videos that significantly outperformed your average. Don’t just note the metrics—identify patterns. Did they all use the same sound? Same video length? Same hook style? Same posting time?
Look for overlap across your best performers:
- Content format: Tutorial, story, trend participation, or educational
- Audio choices: Which sounds appear most in your top videos
- Visual style: Lighting, editing pace, camera angles
- Length: Do longer videos perform better than short ones
- Posting frequency: How often should you post for maximum reach
The pattern becomes your template. If your top five videos all use trending sounds with quick cuts, you’ve found your winning formula.
Optimize Based on Audience Insights
Your analytics reveal who’s actually watching. Use this to refine your content strategy. If 65% of your audience is female ages 18-24, create content that resonates with that demographic.
Analyzing influencer engagement metrics helps identify content strategies that maximize visibility and conversion. When you understand which videos drive product interest, you can produce more of that specific content.
Timing matters too. Your analytics show peak activity hours. If your audience is most active at 7 PM, post then. You’re competing for attention against thousands of other creators—posting at the right moment gives you an advantage.
Test One Variable at a Time
Don’t change everything simultaneously. Pick one element to test: maybe posting time, or video length, or sound choice. Keep everything else identical.
If completion rate drops when you switch from 30-second to 45-second videos, you’ve found your answer. The data guides your next move. This data-driven approach to growth strategies compounds over time as you refine each element.
Your analytics are telling you exactly what your audience wants—you just need to listen and act on it.
Create Content Calendars Based on Data
Use your analytics to build predictive content calendars. If Thursday posts consistently outperform other days, schedule more Thursdays. If dance videos get 40% higher engagement than talking-head videos, allocate more production time to dance content.
Understanding content preferences helps creators tailor strategies and increase followership growth. Your calendar becomes data-informed, not guesswork.
Identify Untapped Opportunities
Analytics reveal gaps. If 40% of your audience is ages 25-34 but you’re creating content for ages 18-24, you’re leaving growth on the table. Expand to address underserved segments.
Look for trending sounds your competitors use that you haven’t tried. Check which hashtags drive traffic to your niche. These represent opportunities to reach new audiences.
Pro tip: Create a simple spreadsheet tracking your top 10 videos with posting time, sound used, length, and completion rate—review it monthly to spot patterns you might miss in the dashboard.
Common Pitfalls in Analyzing TikTok Data
Data can mislead you just as easily as it guides you. Many marketers fall into traps when interpreting TikTok analytics, drawing incorrect conclusions that waste time and resources. Knowing these pitfalls helps you avoid them.
The most dangerous mistake is believing correlation equals causation. Your video performed well the day you posted at 3 PM, but that doesn’t mean 3 PM is always your best time. One video succeeding at one time proves nothing about strategy.
Confusing Correlation with Causation
You post a video on Thursday at 3 PM. It gets 50,000 views. You post another Thursday at 3 PM. It gets 5,000 views. The time wasn’t the variable—the content was. But surface-level analysis misses this.
Understanding algorithmic complexity in data interpretation reveals why single-variable conclusions fail. The algorithm doesn’t care what time you post. It cares whether viewers watch completely and engage.
Test variables systematically. Post identical content at different times. Track completion rates alongside view counts. Isolate one factor at a time.
Over-Relying on Surface-Level Metrics
Views feel important because they’re the biggest number. But a video with 100,000 views and 2% engagement rate failed. A video with 10,000 views and 15% engagement rate succeeded.
Common surface-level mistakes:
- Tracking only view counts: Ignores audience quality and actual interest
- Ignoring completion rates: Views mean nothing if viewers leave after three seconds
- Focusing on likes alone: Comments and shares indicate deeper engagement
- Missing traffic sources: Knowing whether viewers came from FYP or followers changes strategy
- Obsessing over vanity metrics: Follower count grows slower than engagement quality improves
Dig deeper. A small, engaged audience beats a large, passive one every time.
Assuming Your Data Tells the Complete Story
Critical evaluation of TikTok data reveals hidden biases and incomplete transparency in algorithm-driven metrics. TikTok’s algorithm decides what data you see and when you see it. You’re looking at filtered information, not complete truth.
Your analytics dashboard shows only what TikTok chooses to display. You don’t see why the algorithm promoted certain videos or suppressed others. You see results without seeing the decision-making process.
Your analytics answer “what happened,” but they rarely explain “why it happened.” That’s where testing comes in.
Ignoring Seasonal and Trend Variables
A video about holiday shopping performs differently in November than July. Trend cycles affect performance dramatically. If you compare January metrics to June metrics without accounting for seasonal differences, you’ll draw wrong conclusions.
Monitor trending sounds and seasonal patterns that influence performance. What worked last month might not work this month if trends shifted.
Acting Too Fast on Limited Data
One video’s success doesn’t prove your strategy works. You need a sample size. Test five videos with the same approach before declaring it a win. One outlier skews conclusions.
Wait for patterns to emerge across multiple videos before making major strategy shifts. Two weeks of data is noise. Four weeks reveals trends.
Pro tip: Create a hypothesis before analyzing data—“I think shorter hooks increase completion rates”—then test it with five videos before trusting the conclusion.
Harness TikTok Analytics to Accelerate Your Growth Today
Understanding TikTok analytics is essential for marketers eager to boost engagement and refine content strategy. If you are struggling to decode completion rates, engagement patterns, or traffic sources the challenge is real but solvable. The good news is you do not have to navigate this complexity alone. With the right tools you can transform data confusion into actionable insights and unlock your content’s true potential.
Explore how TikTok Tactics empowers creators and marketers by providing real-time analytics, trend alerts, and tailored content calendars designed to increase followers and deepen engagement. Don’t let the overwhelming metrics keep you guessing. Visit TikTok Tactics now to start leveraging performance insights, optimize your posting schedule, and master TikTok marketing strategies that drive sustained growth.
Frequently Asked Questions
What metrics should marketers focus on in TikTok Analytics?
Marketers should prioritize performance metrics such as completion rate, shares, comments, and saves, as these indicate the actual engagement and value of content rather than just vanity metrics like views.
How can I improve my engagement rate on TikTok?
To improve your engagement rate, focus on creating content that resonates with your audience, track your completion rates, and analyze when your followers are most active to optimize posting times.
What is the significance of the completion rate in TikTok Analytics?
The completion rate indicates the percentage of viewers who watch your video to the end. A high completion rate signals that your content is engaging, which can lead to increased visibility due to TikTok’s algorithm favoring content that keeps viewers interested.
How can I use audience insights from TikTok Analytics?
Audience insights, such as demographics and peak activity times, can help you tailor your content strategy to better align with your target audience’s preferences, ensuring that your content resonates and engages effectively.

